
Two main scenarios of the future emerged from the key informant interviews and from a review of existing plans, visions, and surveys. The first scenario is characterized by dispersed development, with a focus on traditional one and two-acre lot residential zoning where most residents continue to live in houses adjoining private lawns, gardens, or small wooded lots (Backyard Amenities). The second vision is characterized by concentrated development with a focus on protection of public woods, open spaces, and waterways for local recreation (Community Amenities).
A third scenario represents a variation on the Community Amenities scenario combined with a significant expansion of agricultural lands (Agricultural Expansion). We also include a continuation of current trends in land cover change (Current Trends). One way that the Current Trends scenario differs from the Backyard Amenities scenario in that population growth is more limited, so less land conversion occurs overall. Like recently published land cover scenarios for Massachusetts (Thompson et al. 2011, 2014), our scenarios capture a broad range of alternatives for land cover composition. The Backyard Amenities and Community Amenities scenarios represent different ends of a spectrum comprising the differences between 1) traditional zoning and smart growth focused on compact urban planning and redevelopment (i.e., dispersed versus concentrated development) and 2) the degree to which ecosystem services are prioritized during development and land management. Thus, our land cover scenarios lie on a continuum from dispersed development that does not prioritize ecosystem services to concentrated development that does prioritize ecosystem services.
Changes in the area of forest, agriculture, and developed land for each of the four land cover scenarios can be viewed here.
For each scenario we produced a land change simulation based on regression tree models of land cover change from 1996 to 2010. Drivers were selected based on availability of full-state coverage, while excluding drivers that would be likely to change over the simulated time interval without being explicitly included in our model. Drivers selected were: current land cover, elevation, slope, soil drainage classification, agricultural soils classification, and distances from major roads, developed land, conserved land, surface water, and population centers of different sizes.
A detailed description of the methods used to create the maps is provided here.
These scenarios reflected alternative combinations of population growth shown in this figure:
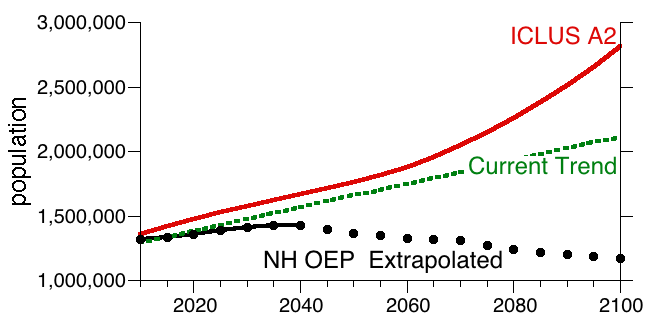
Backyard Amenities: Population growth based on the Integrated Climate and Land Use Scenarios (ICLUS) A2 population scenario (US EPA, 2009, Bierwagen et al. 2010). NH population grows from the current 1.3 million (2014) to 1.8 million by 2050 and 2.8 million by 2100.
Current Trend: Population grows as a linear extrapolation of 1990-2010 rates based on U.S. Census data. The population increases by 103,608 people per decade, resulting in a state population of 2.2 million by 2100, up from the 2010 population of 1.3 million.
Community Amenities & Community Amenities with Agricultural Expansion: Two different population scenarios are used. (1) high projected population growth based on the ICLUS A2 population scenario; (2) Extended NH Office of Energy and Planning (OEP) population projections for New Hampshire counties for 2010-2040 were extrapolated out to 2100.
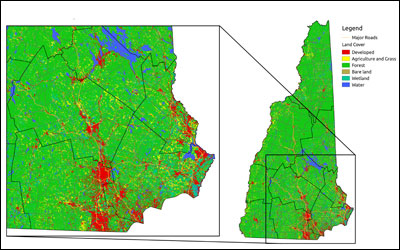
The ultimate product of our efforts is a series of maps depicting change in decadal land cover for each of the four land cover scenarios. Animations of these maps can be viewed here.